Forecasts from Sat, 11 Jul 2026, 12Z for Sat, 11 Jul 2026, 12Z [+0h]
ℹ
Geopotential [gpdm] on 500 hPa (shading)
- Geopotential [gpdm] on 500 hPa (white), contours at 552 gpdm
- Sea-level pressure [hPa] (black), contour interval = 5 hPa
Temperature [°C] on 850 hPa (shading)
- Temperature [°C] on 850 hPa (black dashes), contours at 0 °C
- Sea-level pressure [hPa] (black), contour interval = 5 hPa
- Wind barbs [m/s] on 850 hPa (black)
Temperature anomaly [K] on 850 hPa, based on ERA-5 1979-2020 (shading)
- Temperature percentiles on 850 hPa, based on ERA-5 1979-2020 (black), contours at monthly recurrence
- Temperature percentiles on 850 hPa, based on ERA-5 1979-2020 (grey), contours at yearly recurrence
- Temperature percentiles on 850 hPa, based on ERA-5 1979-2020 (white), contours where new record
Equivalent potential temperature [K] on 850 hPa (shading)
- Frontal volumes on 850 hPa (blue shading), contours at 0.5, 2
- Frontogenesis [K/(100 km)/s] on 850 hPa (dark blue), contours at 0.0002 K/(100 km)/s
- Frontogenesis [K/(100 km)/s] on 850 hPa (dark red), contours at -0.0002 K/(100 km)/s
- Convective available potential energy [J/kg] (light green), contours at 250 J/kg
- Convective available potential energy [J/kg] (yellow), contours at 500 J/kg
- Convective available potential energy [J/kg] (orange), contours at 1000 J/kg
- Convective available potential energy [J/kg] (red), contours at 2000 J/kg
- Sea-level pressure [hPa] (black), contour interval = 5 hPa
Total column water vapour [kg/m²] (shading)
- Column integral water vapour transport vector [kg/s m] (black arrows)
- Large-scale precipitation [mm/h] (magenta), contours at 1, 3, 10 mm/h
- Convective precipitation [mm/h] (cyan), contours at 1, 3, 10 mm/h
- Temperature [°C] on 850 hPa (dark red), contours at -5 °C
Column integral water vapour transport [kg/s m] (shading)
- Moisture transport axes (yellow)
- Large-scale precipitation [mm/h] (magenta), contours at 1, 3, 10 mm/h
- Convective precipitation [mm/h] (cyan), contours at 1, 3, 10 mm/h
- Temperature [°C] on 850 hPa (dark red), contours at -5 °C
10m Wind speed [m/s] (shading)
- 10m Wind gusts [m/s] (dark blue), contours at 17.2 m/s
- 10m Wind gusts [m/s] (orange), contours at 24.5 m/s
- 10m Wind gusts [m/s] (red), contours at 32.7 m/s
- 10m Wind barbs [m/s] (black)
Low cloud cover (shading)
- Mid-level cloud cover (orange shading), contours at 0.01, 0.1, 0.3, 0.5, 0.7, 0.9, 0.99
- High cloud cover (white shading), contours at 0.01, 0.1, 0.3, 0.5, 0.7, 0.9, 0.99
2m Relative humidity [%] (shading)
- Total precipitation [mm/h] (blue shading), contours at -1, 0.1, 0.2, 0.3, 0.5, 0.7, 1.0, 1.4, 2.0, 3.0, 5.0, 7.0, 10.0 mm/h
- Sea ice concentration (violet), contours at 0.2, 0.8
- Temperature [°C] on 850 hPa (dark red), contours at -5 °C
Surface sensible heat flux [W/m²] (shading)
- 10m Wind barbs [m/s] (black)
- Sea-surface temperature [°C] (grey), contours at -1, 0, 2, 4, 6, 8, 10, 12, 14, 16, 18, 20, 22, 24, 26, 28, 30 °C
- Sea ice concentration (violet), contours at 0.2, 0.8
- 10m Wind speed [m/s] (yellow), contours at 17.2 m/s
- 10m Wind speed [m/s] (orange), contours at 24.5 m/s
- 10m Wind speed [m/s] (red), contours at 32.7 m/s
Surface latent heat flux [W/m²] (shading)
- 10m Wind barbs [m/s] (black)
- Sea-surface temperature [°C] (grey), contours at -1, 0, 2, 4, 6, 8, 10, 12, 14, 16, 18, 20, 22, 24, 26, 28, 30 °C
- Sea ice concentration (violet), contours at 0.2, 0.8
- 10m Wind speed [m/s] (yellow), contours at 17.2 m/s
- 10m Wind speed [m/s] (orange), contours at 24.5 m/s
- 10m Wind speed [m/s] (red), contours at 32.7 m/s
Cold-air outbreak index [K] (shading)
- Sea-surface temperature [°C] (grey), contours at -1, 0, 2, 4, 6, 8, 10, 12, 14, 16, 18, 20, 22, 24, 26, 28, 30 °C
- Sea ice concentration (violet), contours at 0.2, 0.8
- 10m Wind speed [m/s] (yellow), contours at 17.2 m/s
- 10m Wind speed [m/s] (orange), contours at 24.5 m/s
- 10m Wind speed [m/s] (red), contours at 32.7 m/s
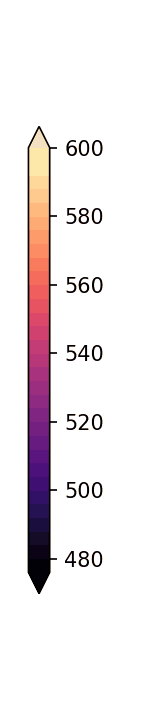
Potential temperature [K] on PV 2 (shading)
- Wind speed filtered to T84 [m/s] on PV 2 (black), contours at 30, 45, 60, 75, 90 m/s
- Jet axes on PV 2 (white, red/blue)

ℹ
Geopotential [gpdm] on 500 hPa (shading)
- Geopotential [gpdm] on 500 hPa (white), contours at 552 gpdm
- Sea-level pressure [hPa] (black), contour interval = 5 hPa
Temperature [°C] on 850 hPa (shading)
- Temperature [°C] on 850 hPa (black dashes), contours at 0 °C
- Sea-level pressure [hPa] (black), contour interval = 5 hPa
- Wind barbs [m/s] on 850 hPa (black)
Temperature anomaly [K] on 850 hPa, based on ERA-5 1979-2020 (shading)
- Temperature percentiles on 850 hPa, based on ERA-5 1979-2020 (black), contours at monthly recurrence
- Temperature percentiles on 850 hPa, based on ERA-5 1979-2020 (grey), contours at yearly recurrence
- Temperature percentiles on 850 hPa, based on ERA-5 1979-2020 (white), contours where new record
Equivalent potential temperature [K] on 850 hPa (shading)
- Frontal volumes on 850 hPa (blue shading), contours at 0.5, 2
- Frontogenesis [K/(100 km)/s] on 850 hPa (dark blue), contours at 0.0002 K/(100 km)/s
- Frontogenesis [K/(100 km)/s] on 850 hPa (dark red), contours at -0.0002 K/(100 km)/s
- Convective available potential energy [J/kg] (light green), contours at 250 J/kg
- Convective available potential energy [J/kg] (yellow), contours at 500 J/kg
- Convective available potential energy [J/kg] (orange), contours at 1000 J/kg
- Convective available potential energy [J/kg] (red), contours at 2000 J/kg
- Sea-level pressure [hPa] (black), contour interval = 5 hPa
Total column water vapour [kg/m²] (shading)
- Column integral water vapour transport vector [kg/s m] (black arrows)
- Large-scale precipitation [mm/h] (magenta), contours at 1, 3, 10 mm/h
- Convective precipitation [mm/h] (cyan), contours at 1, 3, 10 mm/h
- Temperature [°C] on 850 hPa (dark red), contours at -5 °C
Column integral water vapour transport [kg/s m] (shading)
- Moisture transport axes (yellow)
- Large-scale precipitation [mm/h] (magenta), contours at 1, 3, 10 mm/h
- Convective precipitation [mm/h] (cyan), contours at 1, 3, 10 mm/h
- Temperature [°C] on 850 hPa (dark red), contours at -5 °C
10m Wind speed [m/s] (shading)
- 10m Wind gusts [m/s] (dark blue), contours at 17.2 m/s
- 10m Wind gusts [m/s] (orange), contours at 24.5 m/s
- 10m Wind gusts [m/s] (red), contours at 32.7 m/s
- 10m Wind barbs [m/s] (black)
Low cloud cover (shading)
- Mid-level cloud cover (orange shading), contours at 0.01, 0.1, 0.3, 0.5, 0.7, 0.9, 0.99
- High cloud cover (white shading), contours at 0.01, 0.1, 0.3, 0.5, 0.7, 0.9, 0.99
2m Relative humidity [%] (shading)
- Total precipitation [mm/h] (blue shading), contours at -1, 0.1, 0.2, 0.3, 0.5, 0.7, 1.0, 1.4, 2.0, 3.0, 5.0, 7.0, 10.0 mm/h
- Sea ice concentration (violet), contours at 0.2, 0.8
- Temperature [°C] on 850 hPa (dark red), contours at -5 °C
Surface sensible heat flux [W/m²] (shading)
- 10m Wind barbs [m/s] (black)
- Sea-surface temperature [°C] (grey), contours at -1, 0, 2, 4, 6, 8, 10, 12, 14, 16, 18, 20, 22, 24, 26, 28, 30 °C
- Sea ice concentration (violet), contours at 0.2, 0.8
- 10m Wind speed [m/s] (yellow), contours at 17.2 m/s
- 10m Wind speed [m/s] (orange), contours at 24.5 m/s
- 10m Wind speed [m/s] (red), contours at 32.7 m/s
Surface latent heat flux [W/m²] (shading)
- 10m Wind barbs [m/s] (black)
- Sea-surface temperature [°C] (grey), contours at -1, 0, 2, 4, 6, 8, 10, 12, 14, 16, 18, 20, 22, 24, 26, 28, 30 °C
- Sea ice concentration (violet), contours at 0.2, 0.8
- 10m Wind speed [m/s] (yellow), contours at 17.2 m/s
- 10m Wind speed [m/s] (orange), contours at 24.5 m/s
- 10m Wind speed [m/s] (red), contours at 32.7 m/s
Cold-air outbreak index [K] (shading)
- Sea-surface temperature [°C] (grey), contours at -1, 0, 2, 4, 6, 8, 10, 12, 14, 16, 18, 20, 22, 24, 26, 28, 30 °C
- Sea ice concentration (violet), contours at 0.2, 0.8
- 10m Wind speed [m/s] (yellow), contours at 17.2 m/s
- 10m Wind speed [m/s] (orange), contours at 24.5 m/s
- 10m Wind speed [m/s] (red), contours at 32.7 m/s
Potential temperature [K] on PV 2 (shading)
- Wind speed filtered to T84 [m/s] on PV 2 (black), contours at 30, 45, 60, 75, 90 m/s
- Jet axes on PV 2 (white, red/blue)
- ∣ ≪
- ≪
- ►
- ❚❚
- ≫
Lead time:
- 0
- 12
- 24
- 36
- 48
- 60
- 72
- 84
- 96
- 108
- 120
- 132
- 144
- 156
- 168
- 180
- 192
- 204
- 216
- 228
- 240